--
參考資源
結論:只要使用 wkhtmltopdf 0.12.6 之後的版本應該就比較沒問題
--
|
1 2 3 4 5 6 7 8 9 10 11 12 13 14 15 16 17 18 19 20 21 22 23 24 25 26 27 28 29 30 31 32 33 34 35 36 37 38 39 40 41 42 43 44 45 46 47 48 49 50 51 52 53 54 55 56 57 58 59 60 61 62 |
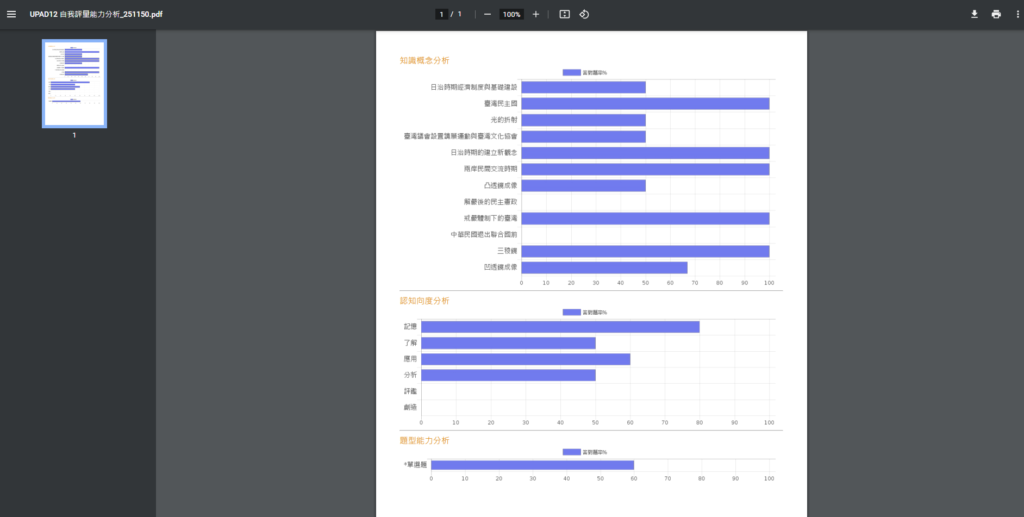
$HTML = <<<HTML <!DOCTYPE html> <html lang="en"> <head> <meta charset="utf-8"> <script src="https://cdnjs.cloudflare.com/ajax/libs/Chart.js/2.3.0/Chart.min.js"></script> <style> .reportGraph {width:900px} </style> </head> <body> <div>知識概念分析</div> <div id="chart1_box" class="reportGraph"> <canvas id="chart1"></canvas> </div> <div>認知向度分析</div> <canvas id="chart2"></canvas> <div>題型能力分析</div> <canvas id="chart3"></canvas> <div class="reportGraph"><canvas id="canvas"></canvas></div> <script> function drawGraphs() { new Chart( document.getElementById("chart1"), { type: 'horizontalBar', data: { labels: ["絕對值", "數線上兩點的距離", "數的大小", "數線", "正數與負數"], datasets: [{ label: '答對題率%', backgroundColor: 'rgb(113, 123, 237)', borderColor: 'rgb(113, 123, 237)', data: [0, 20, 33, 25, 50], }] }, options: { maintainAspectRatio: false, animation: false, scales: { xAxes: [{ ticks: { min: 0, max: 100, stepSize: 10 } }] } }, } ); } window.onload = function() { drawGraphs(); }; </script> </body> </html> HTML; |
成果

--
除錯
如果發現沒有圖顯示,可以朝兩個方向除錯
- <div> 容器是否有設定寬度 width: 900px
- 生成資料需要時間 wkhtmltopdf 加上 --javascript-delay 試試看,預設是 200ms 如果生成資料不夠快就適度延長
--
1,004 total views, 2 views today